We test the idea of visualizing economic statistics data on self-organization related maps, which are the LLE, ISOMAP and GTM maps. We report initial results of this work. These three maps all have distinguished theoretical foundations. The statistic data usually span high-dimensional space, sometimes more than 10 dimensions. To perceive these data as a whole and to foresee future trends, perspective visualization assistance is an important issue. We use economic statistics for the United States over the past 26 years (1977 to 2002) and apply them on the maps. The results from these three maps display historic events along with their trends and significance.
"Cheng-Yuan
Liou and Yen-Ting Kuo(2002), Economic state indicator on neuronic map, 9’th
International Conference on Neural Information Processing, ICONIP’2002, vol.2,
pp. 787-791, Nov. 18~22, 2002, Singapore
Download the original paper <PDF> <PS>
You can also see the presentation version <PDF>
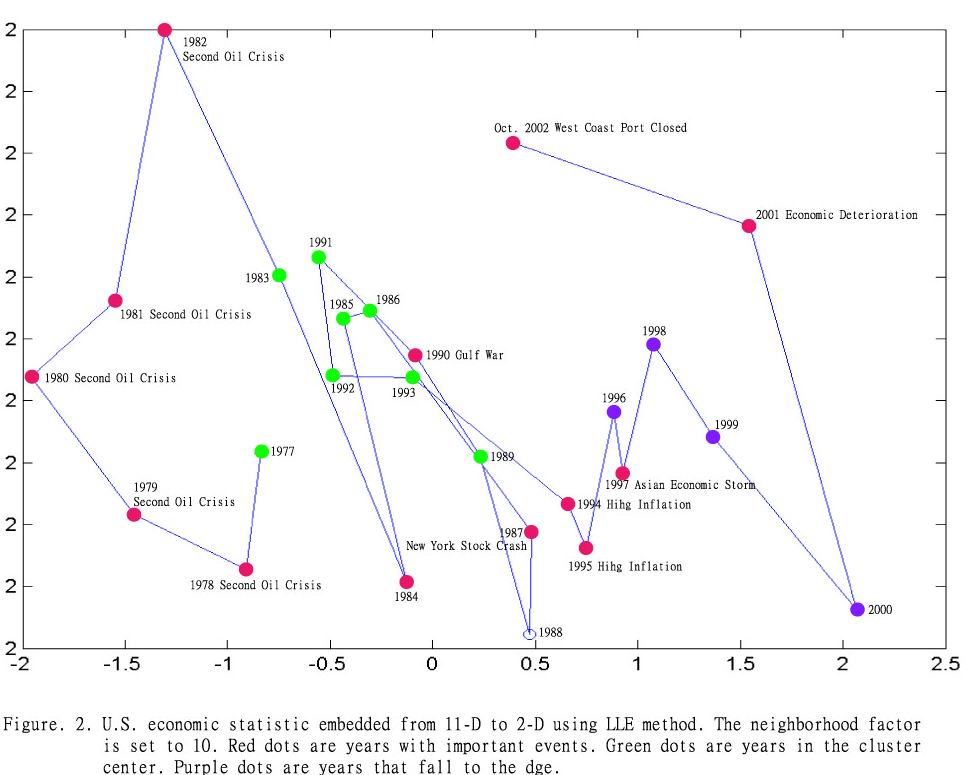
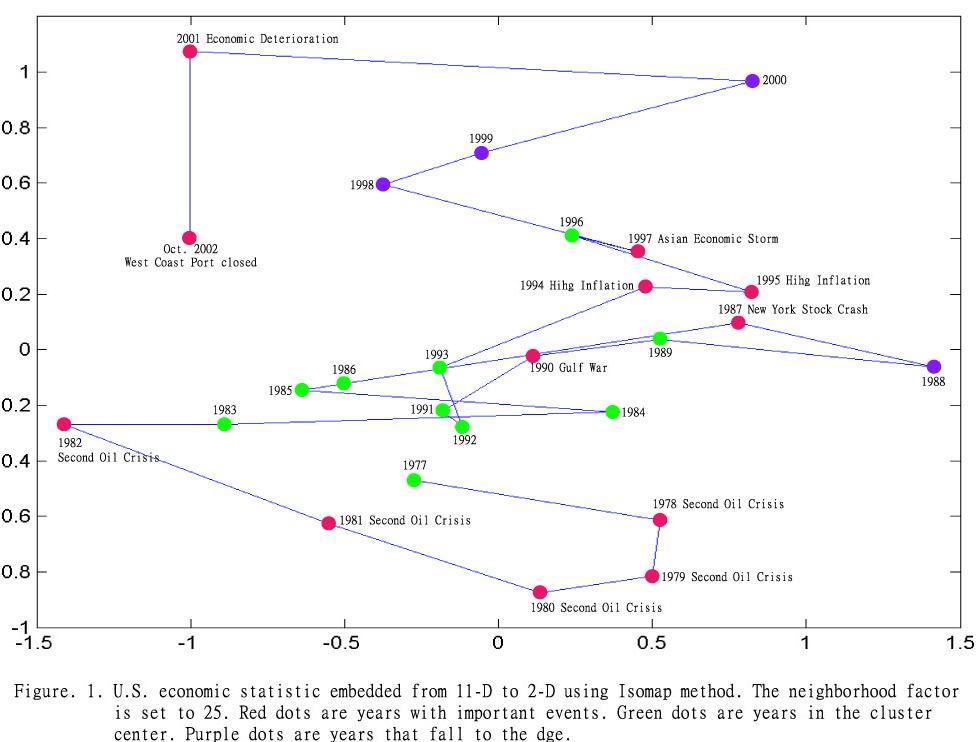
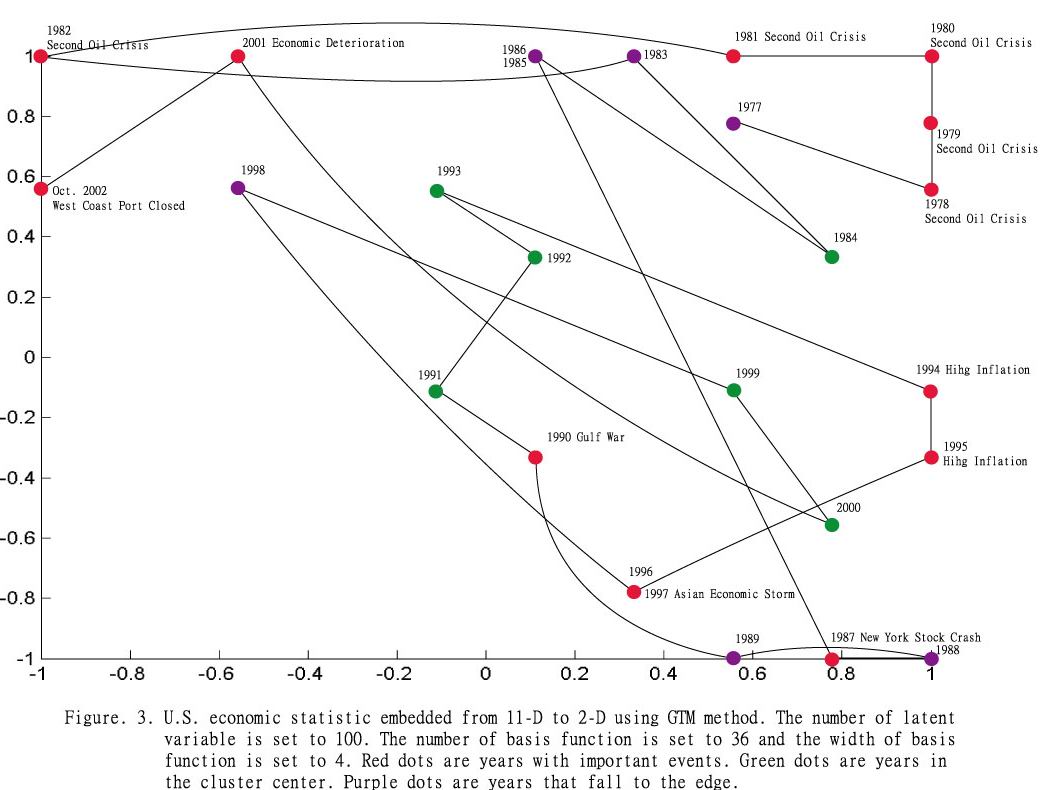
This simulation uses U.S. past 26 years (1977~2002) economic states.
|
LLE method. (click fig. to enlarge) |
Isomap method. (click fig. to enlarge) |
GTM method. (click fig. to enlarge) |
|
Click below to see animated GIF files |
||
|
LLE method. (click fig. to enlarge) |
Isomap method. (click fig. to enlarge) |
GTM method. (click fig. to enlarge) |